Learn
Barnegat Bay 101
Watershed Map
Bay Species Database
Education and Outreach
Education Grants
Map Resources
Speaker’s Bureau
Protect
About BBP Programs
Threats to the Bay
Bay Science and State of the Bay
Bay Studies and Reports
How to Protect the Bay
Barnegat Bay Blitz 2024
Bay Restoration
Explore
Events and Festivals
Motorized Boating
Ecotourism and Paddling
Fishing and Crabbing
Menu
☰
About Us
Contact Us
News/Blog
Volunteer
Events
Search
Learn
Barnegat Bay 101
Watershed Map
Bay Species Database
Education and Outreach
Education Grants
Map Resources
Speaker’s Bureau
Protect
About BBP Programs
Threats to the Bay
Bay Science and State of the Bay
Bay Studies and Reports
How to Protect the Bay
Barnegat Bay Blitz 2024
Bay Restoration
Explore
Events and Festivals
Motorized Boating
Ecotourism and Paddling
Fishing and Crabbing
About Us
Contact Us
News/Blog
Volunteer
Events
Search
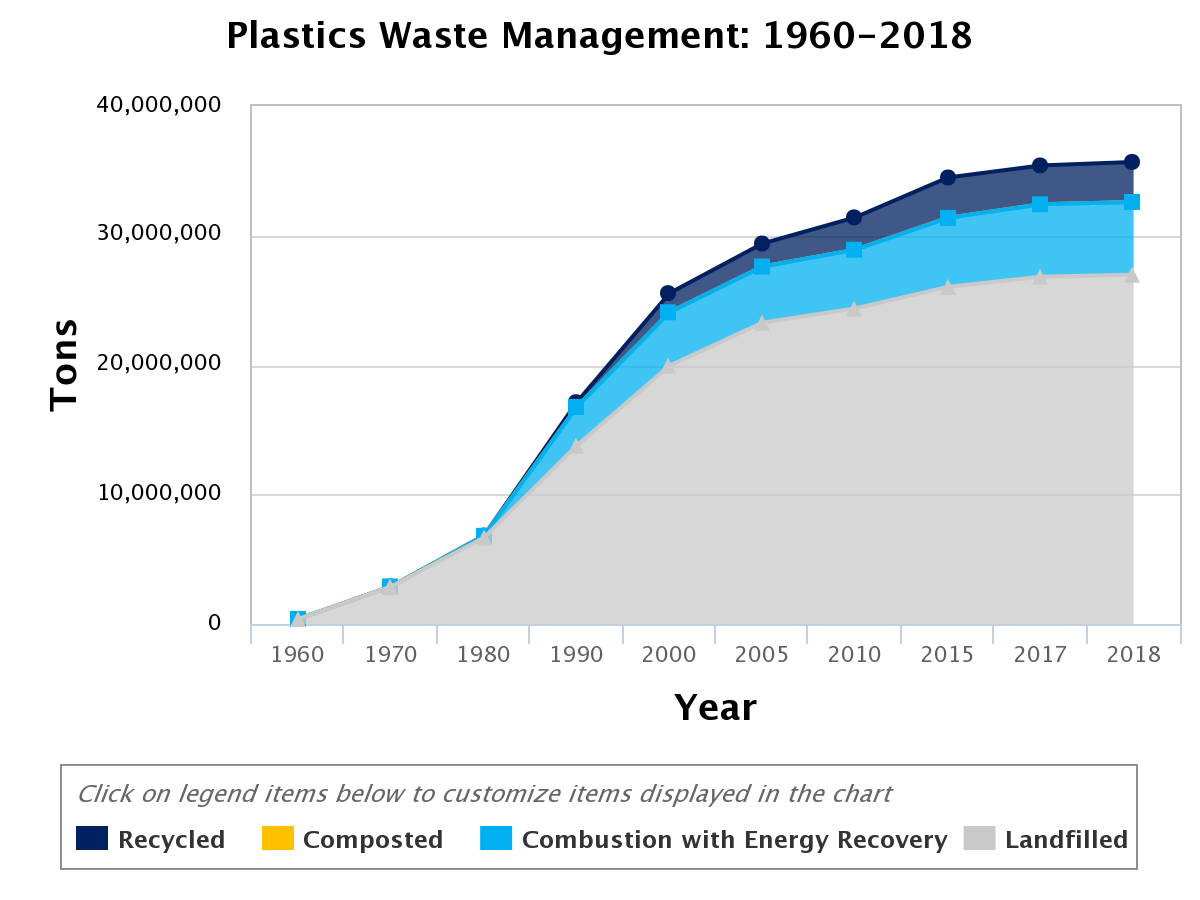
Barnegat Bay is Worth More Than One Use!
» chart-1
Connect with Us
Sign up for email or connect through social media.
First Name
Last Name
Email Address
We use cookies to ensure that we give you the best experience on our website. If you continue to use this site we will assume that you are happy with it.
Ok